
[vc_row][vc_column][vc_column_text]The Trin, the Tick and the Tiki walked into a bar…
Ok, Jokes aside… “Market Internals” can be very valuable tools that traders can access in most decent charting platforms. There are several other market internals that you can use but I will save that for another day.
Before I talk about The Trin, the Tick and the Tiki I want to quickly make sure you are up to speed with some of the terms that are used to calculate these market internals.
Issues
Issues are basically stocks or bonds listed on an exchange, they are the tradeable assets and symbols that we load into our charting platform each day.
1. The process of offering securities as an attempt to raise funds. Companies may issue bonds or shares to investors as a method of financing the business.
2. A series of stocks or bonds that have been offered to the public. A bond or stock issue relates to the set of instruments that were released under one offering.
Advances and Declines
Advances and Declines are basically terms used to describe stocks that are up or down at the end of each trading day. For example, if an exchange had 300 tradable stocks listed and at the end of the day 100 stocks had gone up in price and 200 stocks had gone down in price, we would say that there was 100 advances and 200 declines.
The number of stocks that closed at a higher price than the previous day’s close, and the number of stocks that closed at a lower price than the previous day’s close. Technical analysts looks at advances and declines to analyze the overall behavior of the stock market, in order to discern volatility and to predict whether a price trend is likely to continue or reverse. Typically, a market will be more bullish if more stocks advance than decline.
–“Advances And Declines” on Investopedia
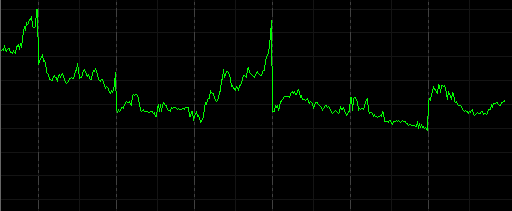
The $TRIN
The $TRIN or the Arms Index was invented by Richard W. Arms, Jr. in 1967. The TRIN literally means Traders Index and is the measure of how much volume is behind advancing and declining stocks that are listed on the New York Stock Exchange (NYSE). Because the data comes from the NYSE, traders use it to gauge what the US Market sentiment is.
Traders will look at the value of the TRIN throughout the trading day and primarily use it for intraday trading. If the TRIN value is above 1 that is considered to be bearish, if the value is below 1 that is said to be bullish and If the value is 1 or very close to 1 that is said to be balanced market. Because the TRIN can be plotted like a normal chart it is possible to use indicators and standard technical analysis to help understand the data. Some traders will use a 10-period moving average to gauge where price might be headed.
The TRIN (Arms index) is calculated as follows:
$TRIN = (advancing issues / declining issues)
(volume of advancing issues /
volume of declining issues)
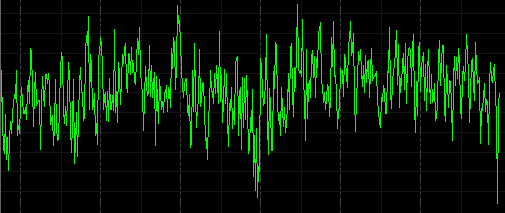
The $TICK
“TICKS”, “The TICK” or the “TICK index” is the names used for a market internal that shows whether there are more individual stocks with increasing or decreasing price, it is a comparison of the number of upticking stocks vs the downticking stocks. Values above zero are said to be bullish while values below zero are said to be bearish. The data comes from the New York Stock Exchange (NYSE) so again it is used to gauge US market sentiment. According to TradeStation the $TICK is a short-term barometer of internal market strength.
One theory is that when the $TICK approaches +1000 or -1000 you should be very careful as this can indicate the market is extremely overbought or oversold.
The TICK is calculated as follows:
$TICK = Upticking Stocks – Downticking Stocks
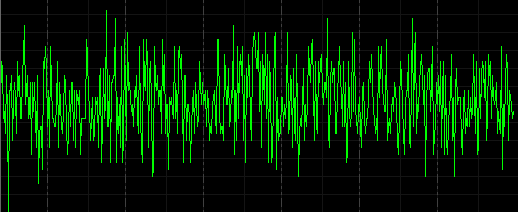
The $TIKI
The Tick Index and the Tiki are very similar. They are calculated exactly the same but the difference is that the $TIKI is based on data from the Dow Jones Industrial Average. It uses the 30 companies that are listed in the DOW also known as the DOW 30. The DOW 30 represents thirty of the largest companies in America from different industry sectors. The Tiki looks at the number of Dow stocks that are rising and the number of Dow stocks that are falling.
The TIKI is calculated as follows:
$TIKI = Upticking Stocks – Downticking Stocks
More on Market Internals
As always I opened up a bit of a can of worms while researching this information so keep an eye for a future blog post where I will discuss some of the things I have learned about Market Internals and Market Volume.[/vc_column_text][/vc_column][/vc_row]