
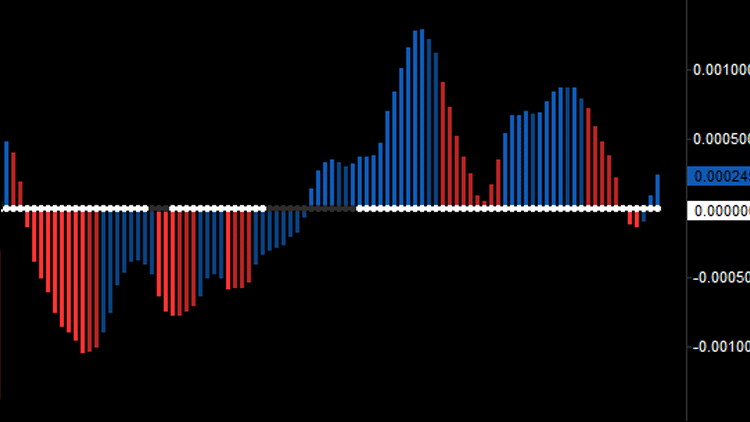
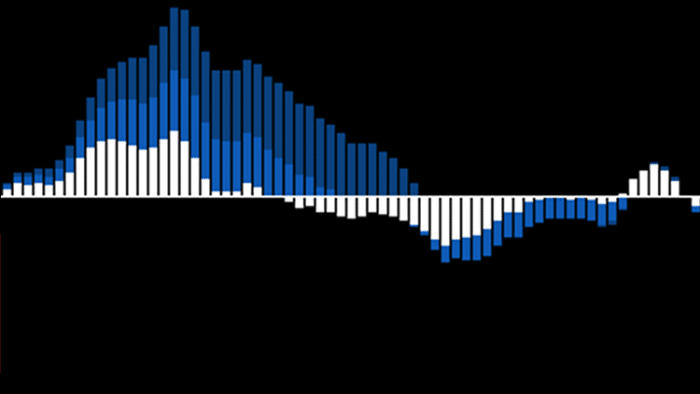
Introducing the Value Chart Indicator, a groundbreaking tool designed with precision to identify market extremes with needle-like accuracy. This innovative indicator is your key to unlocking insights into overbought and oversold territories, providing a clear indication when a market is poised for reversal.
Leveraging the Value Chart Indicator places you ahead of the competition, offering unparalleled insight into market movements and potential reversal points. It’s an essential tool for traders looking to capitalize on short-term market fluctuations.
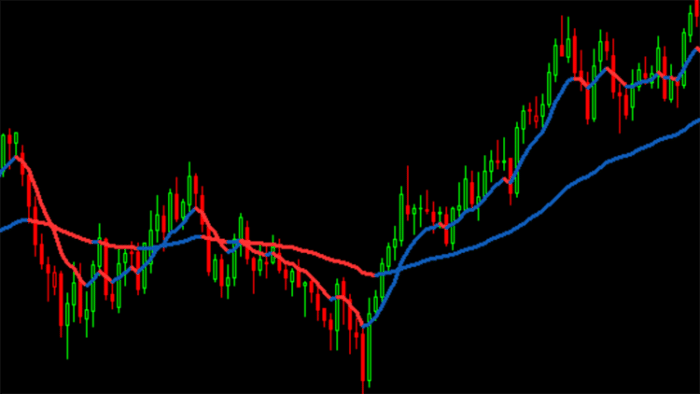
For an unbeatable scalping setup, pair the Value Chart with the Linear Regression Channel Indicator. This combination offers a robust framework for identifying and acting on quick market movements, ensuring you stay one step ahead in the trading game.
Embrace the precision and clarity of the Value Chart Indicator to navigate market extremes with confidence. Elevate your trading toolkit today and unlock the potential of every trade.
If you are new to trading and do not yet have a trading platform, we highly recommend NinjaTrader, its full of features, a trading simulator and great support click here to get started for FREE today.
£69.00
£69.00
£85.00
£10.00
£85.00
£85.00
£69.00
James –
Thank your prestige, I have been looking for a Value Chart for a long time, I have found a lot available out there but nothing like this one. This is what I am used to trading. Great indicator thank you.