

£69.00
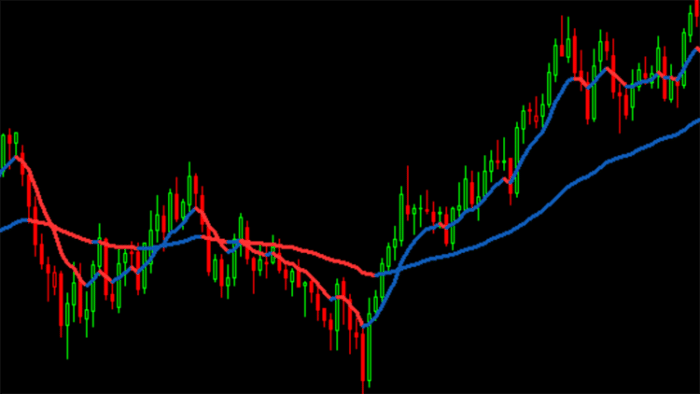
Introducing the Linear Regression Channel Indicator, a sophisticated tool designed to offer objective buy and sell signals by harnessing price volatility. This dynamic indicator is your guide to navigating market movements with confidence, providing real-time, adaptable insights directly on your chart.
When the price dips below the lower channel line, it triggers a buy signal, suggesting an undervalued condition. Conversely, breaking above the upper channel line signals a sell opportunity, indicating overvaluation. Prolonged closure outside of the Linear Regression Channel hints at a potential shift in the prevailing price trend, pointing towards a significant market reversal.
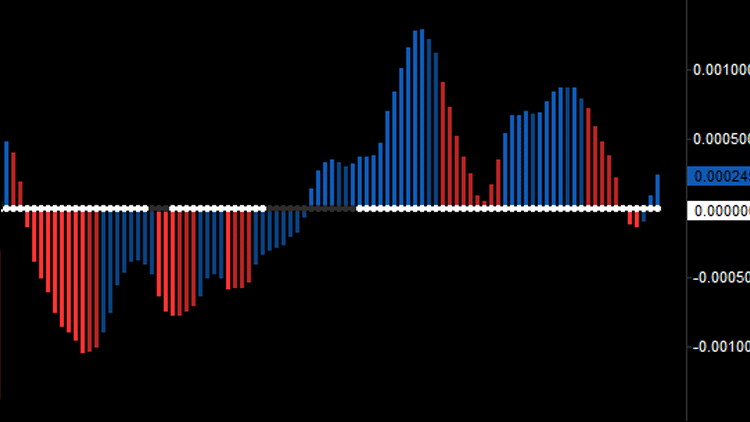
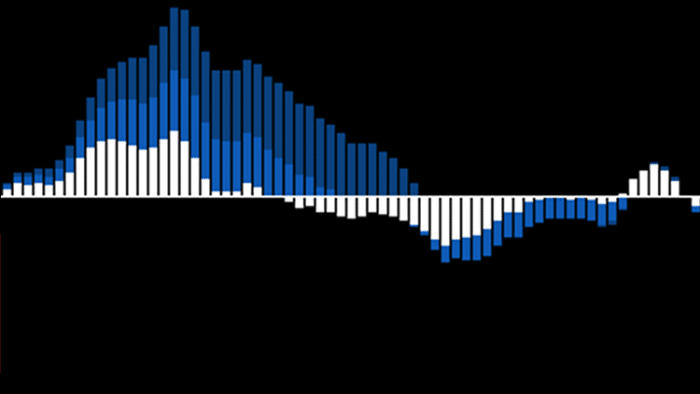
The Linear Regression Channel Indicator is more than just a trading tool; it’s a comprehensive analysis instrument. By integrating standard deviation calculations, it provides insights into overbought or oversold conditions relative to the current trend, enabling traders to make more informed decisions.
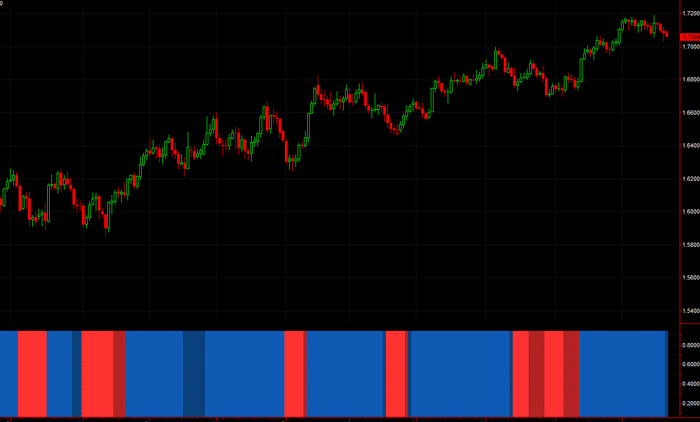
For optimal scalping efficiency, pair the Linear Regression Channel Indicator with the Value Chart Indicator. This powerful combination offers a robust framework for identifying quick market movements, securing your trading advantage.
Unlock the potential of your trading strategy with the precision and clarity of the Linear Regression Channel Indicator. Discover how this tool can transform your market analysis and help you make strategic, informed trading decisions.
If you are new to trading and do not yet have a trading platform, we highly recommend NinjaTrader, its full of features, a trading simulator and great support click here to get started for FREE today.
£69.00
£85.00
£10.00
£85.00
£85.00
£85.00
£69.00
Dean Jackman –
This indicator has really helped with my trading on smaller time frames, i like the way you can choose how many bars it draws the line over.