
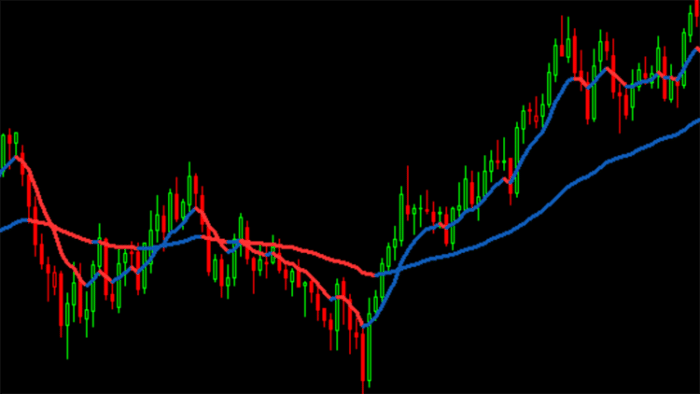
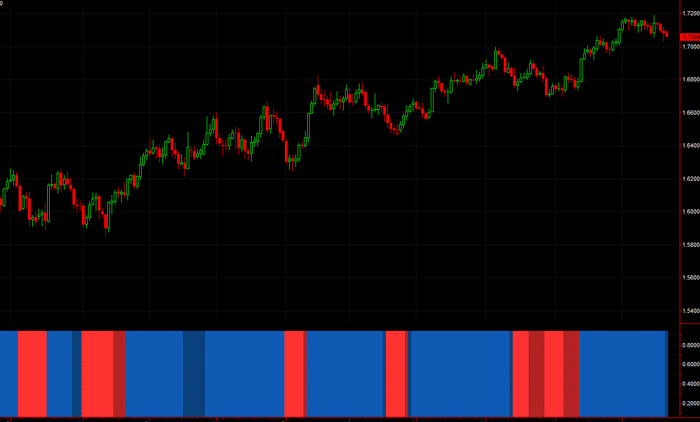
Elevate your trading strategy with our advanced Moving Average Indicator, designed to deliver real-time, color-coded insights into market trends. This innovative indicator simplifies market analysis by vividly displaying price movements in relation to the moving average, making it an indispensable tool for traders seeking clarity and precision in their trading decisions.
Instant Alerts: Receive on-screen, audio, and email alerts whenever a color change occurs, signaling an important directional shift in the market. Customize alert settings easily within the settings pane for a tailored alert experience.
For an exceptional trading setup, pair our Moving Average Indicator with the MACD Indicator. This combination offers a layered analytical approach, enhancing your ability to identify and act on potential market movements effectively.
Secure your custom Moving Average Indicator today and transform your charts into a powerful analytical tool, ensuring you never miss a pivotal market movement again.
If you are new to trading and do not yet have a trading platform, we highly recommend NinjaTrader, its full of features, a trading simulator and great support click here to get started for FREE today.
£69.00
£69.00
£85.00
£85.00
£85.00
£85.00
£69.00
Kim –
Thanks for the free indicator. Love it, I’m now trading the crossovers that Christopher recommended and it’s working good. Who would have thought.